Portfolio Sherpa
Strategic oversight across your entire project pipeline.
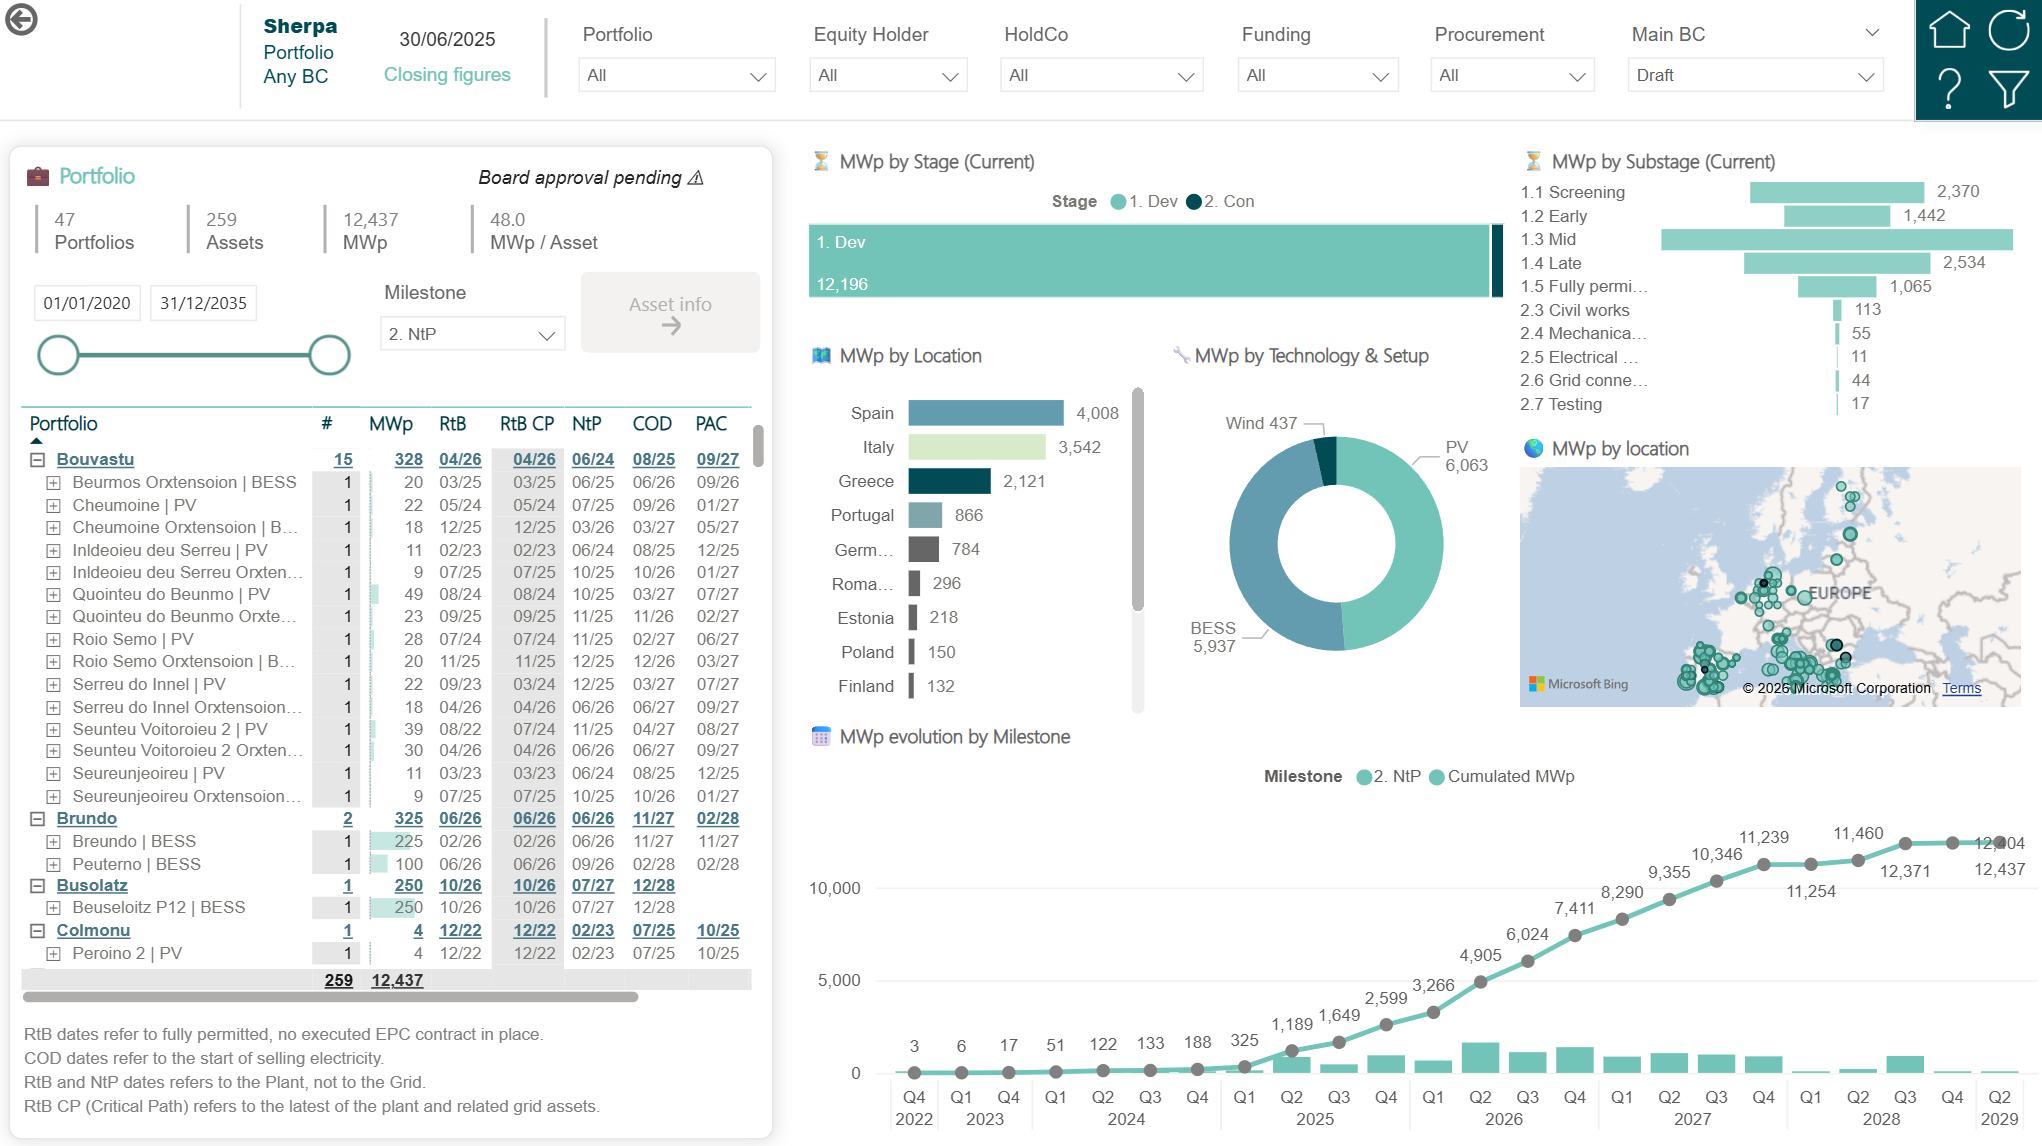
Know exactly where every megawatt stands. Portfolio Sherpa gives leadership and investment teams a real-time view of every renewable energy project — filtered by technology, stage, region, or custom metrics. From screening to operation, in a single dashboard.
Sound familiar?
Scattered across spreadsheets
Your project pipeline lives in 5 different Excel files, 3 SharePoint folders, and someone's email. No single source of truth.
No portfolio visibility
Leadership can't answer "how many MW are in permitting?" without asking 3 people and waiting 2 days.
Manual investor reporting
Every board report requires hours of copy-pasting data from multiple sources into a PowerPoint deck.
Everything you need
Multi-project dashboard
See every project on a single screen. Filter by technology (Solar, Wind, BESS), development stage, region, or any custom metric your team defines.
Configurable metrics
Track the KPIs that matter to your business. Installed capacity, secured area percentage, contract count — all configurable per tenant without code changes.
Version benchmarking
Compare Draft vs. Budget vs. Forecast snapshots side by side. Understand exactly how your project timeline shifted and why, with per-milestone deviation analysis.
One-click data export
Export any filtered view to CSV or Excel. Generate investor-ready datasets in seconds instead of hours of manual compilation.
Interactive map view
See your entire portfolio on a map with project coordinates and plot geometries. Click any marker to drill into project details. PostGIS-powered spatial visualization.
Multi-tenant isolation
Each client organization gets a fully isolated workspace. Your data never mixes with another company's. Role-based access ensures the right people see the right projects.
How it works
Import your projects
Create projects manually or sync from your existing data warehouse via our Redshift integration. Set technology type, stage, installed capacity, and location.
Configure your metrics
Define the KPIs your team tracks. Choose from built-in metric types or create custom ones. Set up milestone definitions that match your development workflow.
Get instant visibility
Open the dashboard and see your entire pipeline at a glance. Filter, compare versions, export for investors, and make decisions backed by real-time data.
Ready to see your entire portfolio in one place?
Join renewable energy developers who replaced 5 spreadsheets with one dashboard.